


 פרסום פרויקט
 התחבר עם פייסבוק

 5 צפיות
 0 שבחים
Entry content
Entry content
Entry content

Entry content
Entry content
Entry content
Entry content
Entry content
Entry content
Entry content
Entry content
Entry content
Entry content
Entry content
Entry content
Entry content
Entry content
Entry content
Entry content
Entry content
Entry content
Entry description
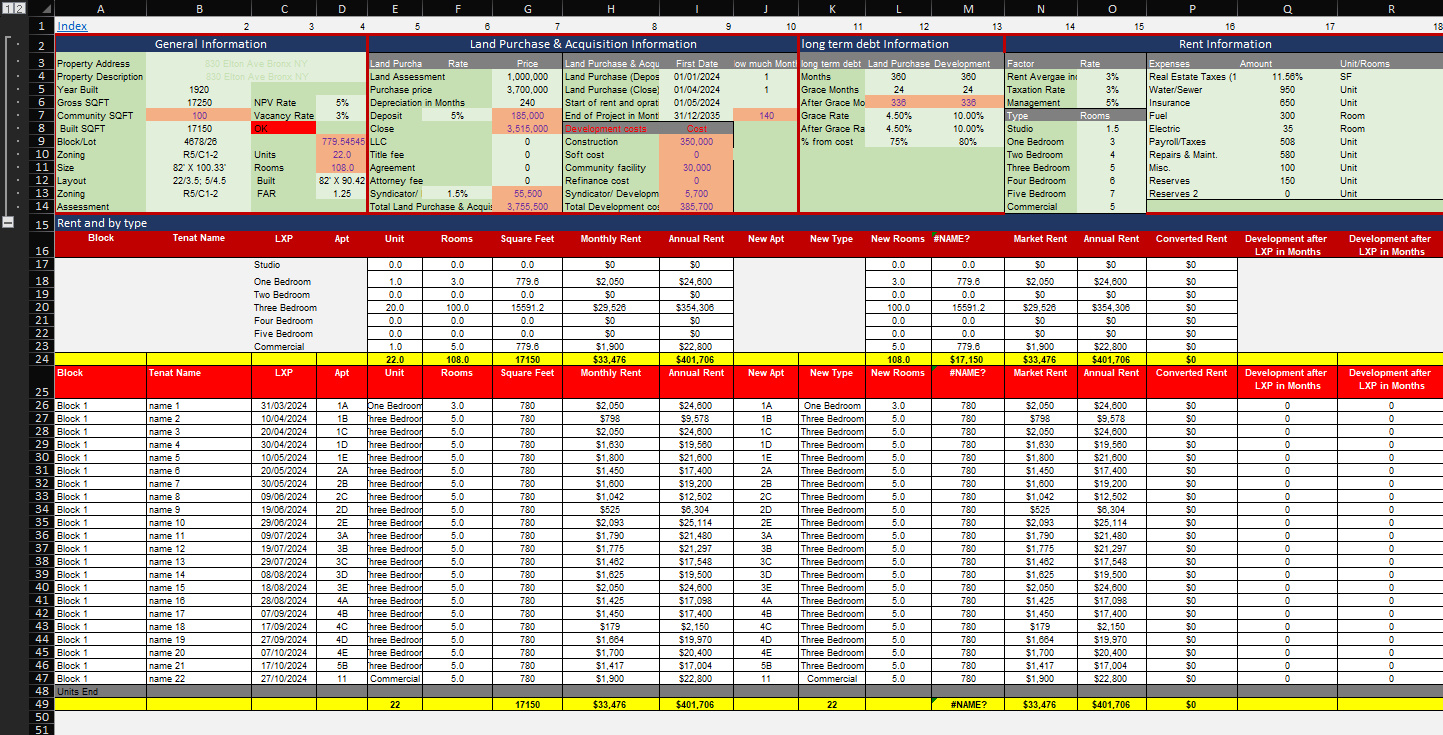
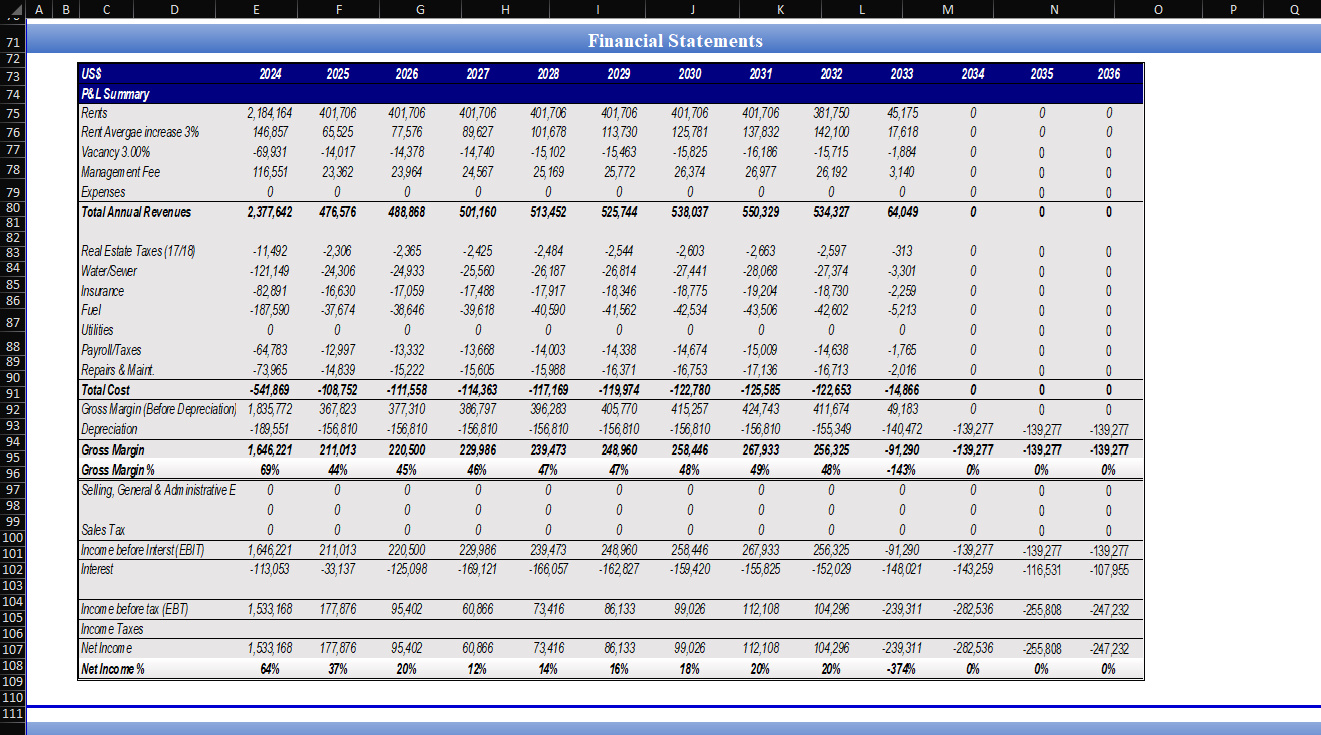
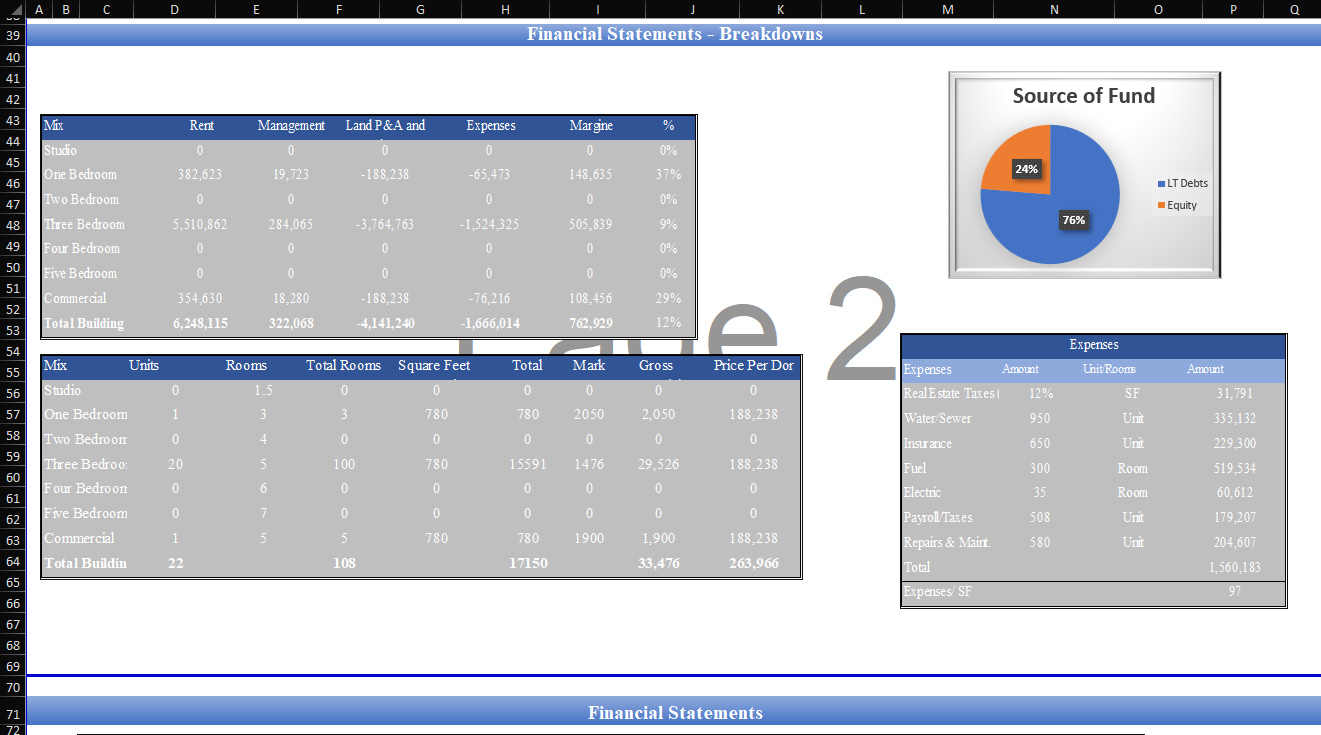
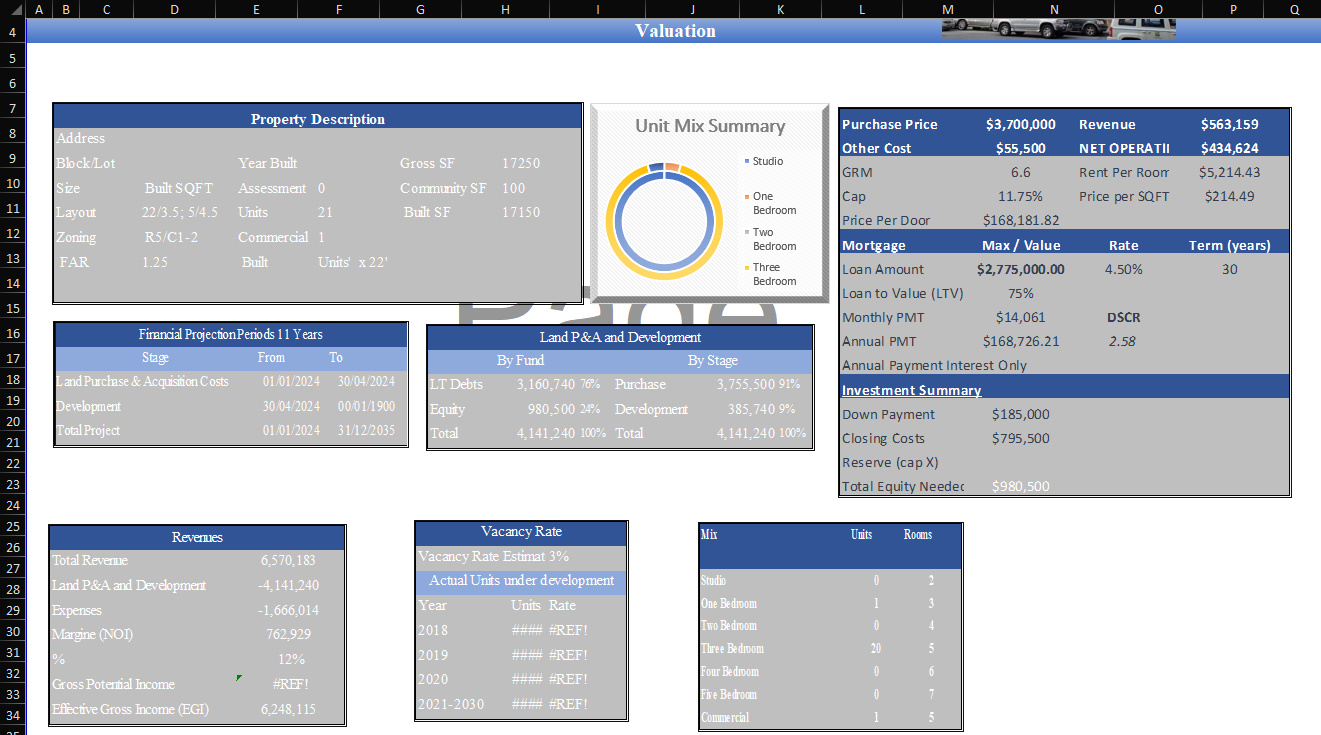
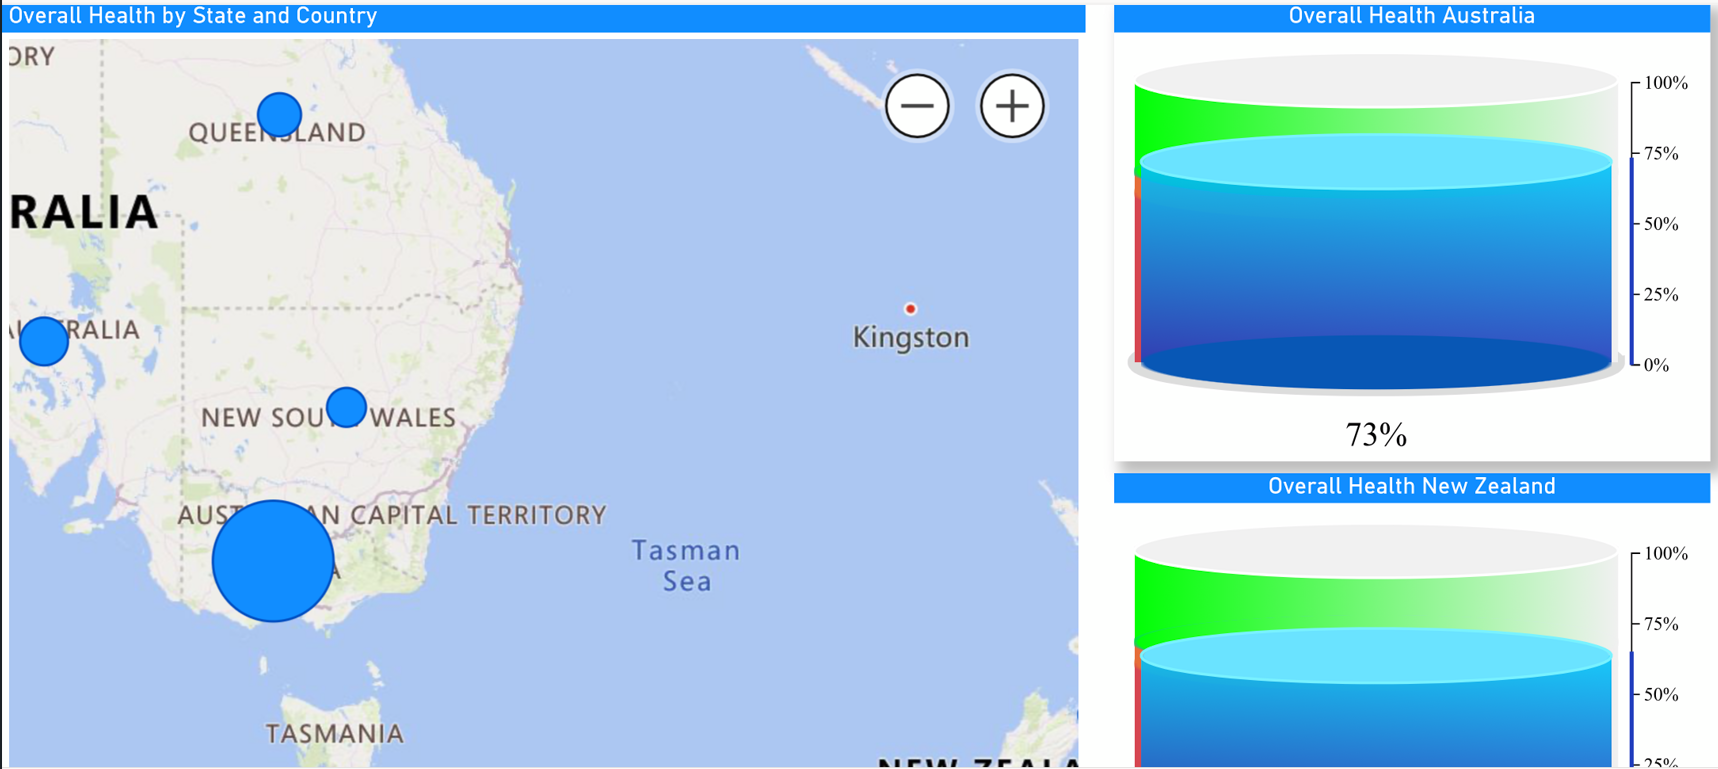
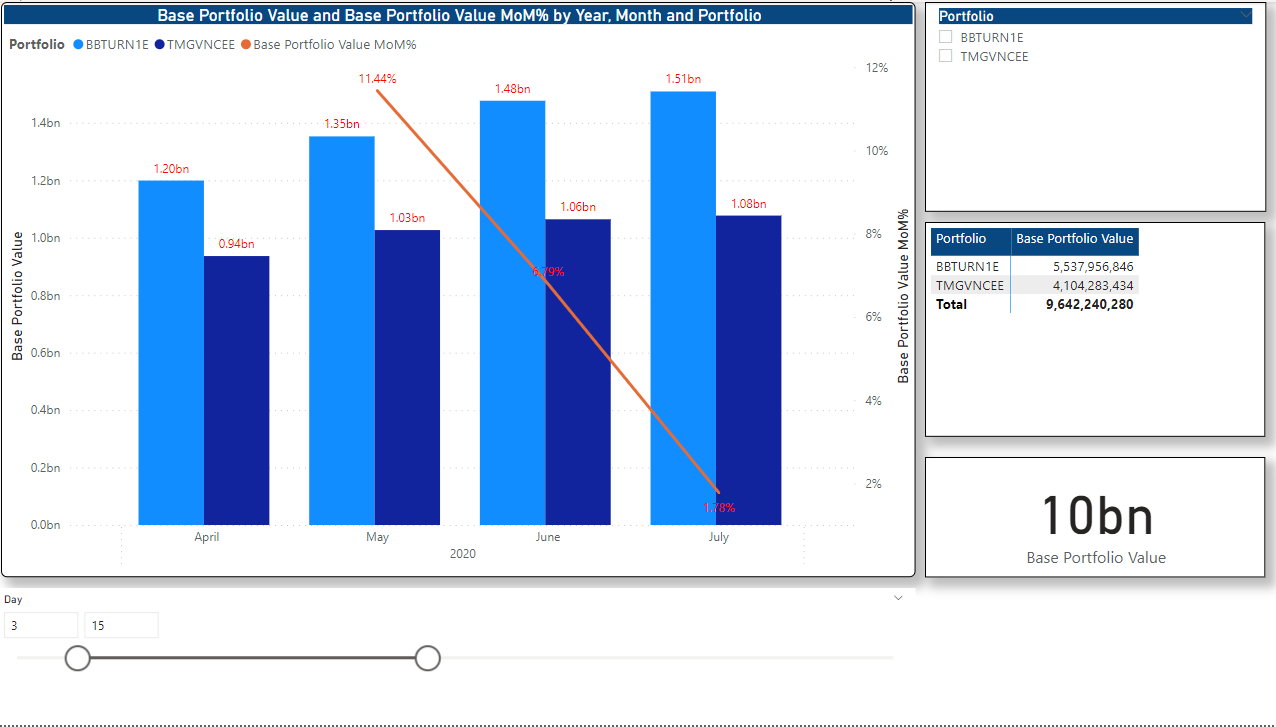
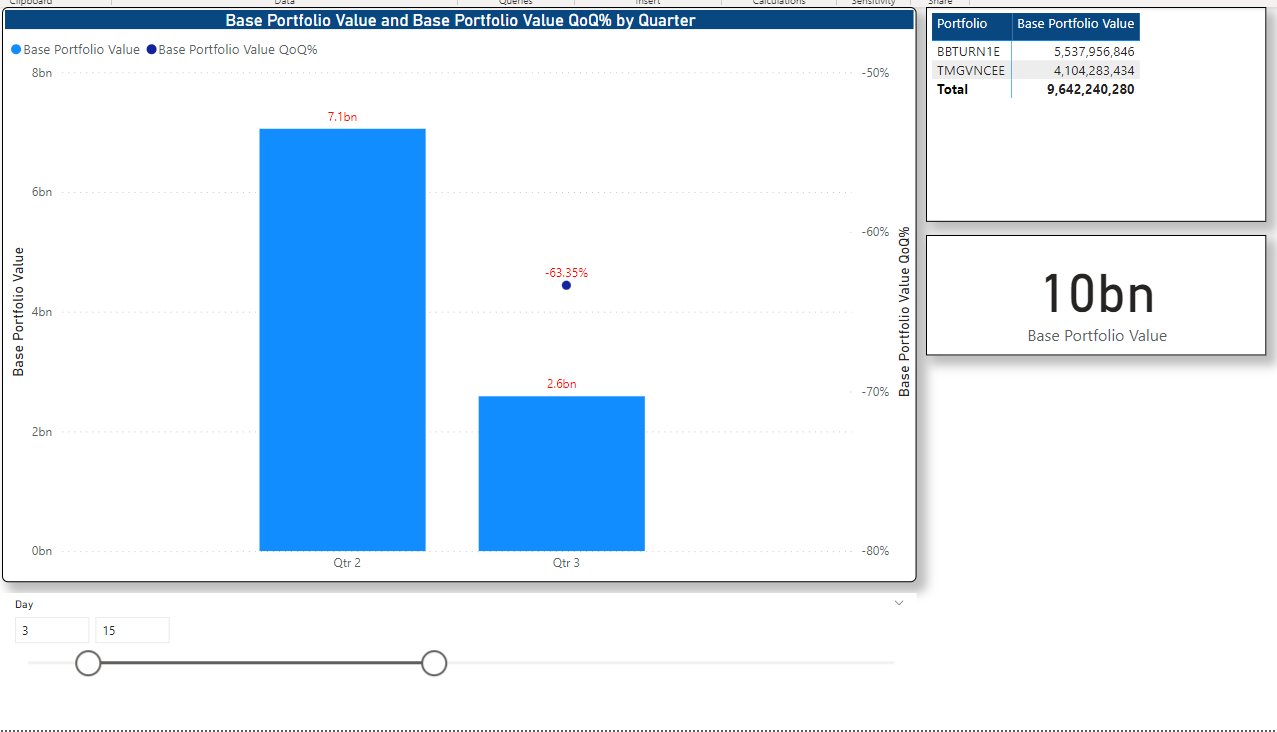
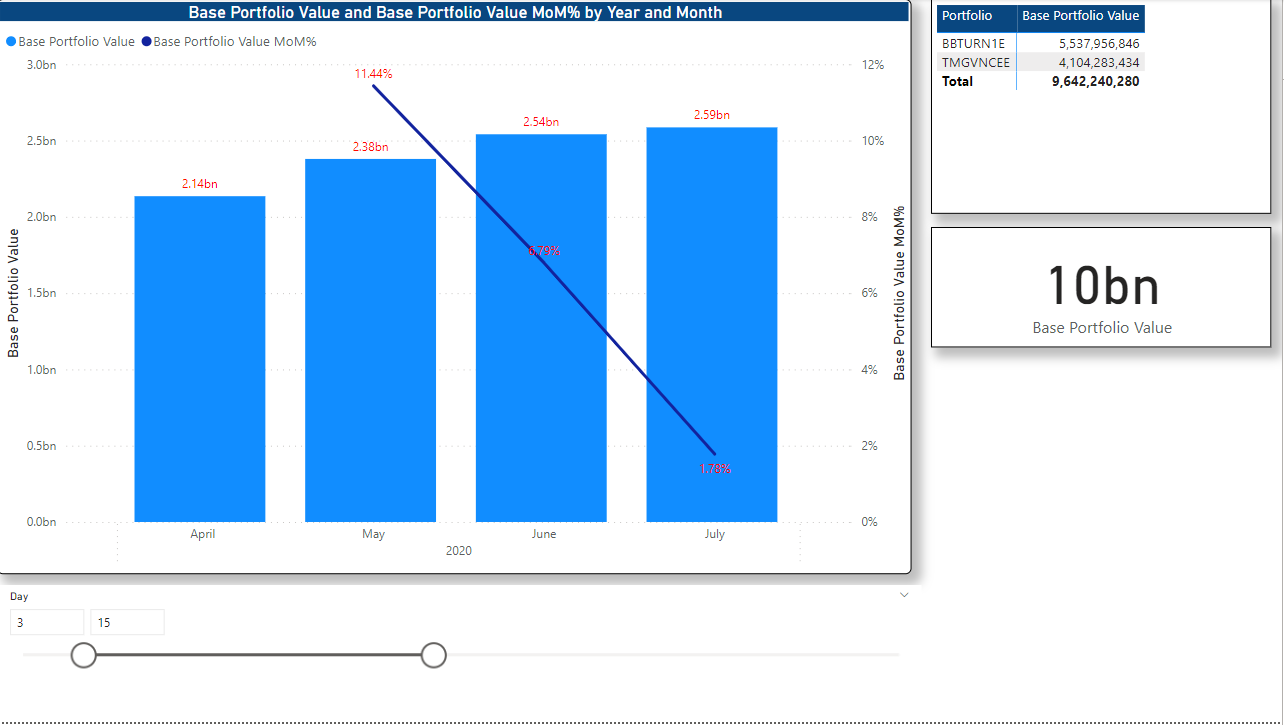
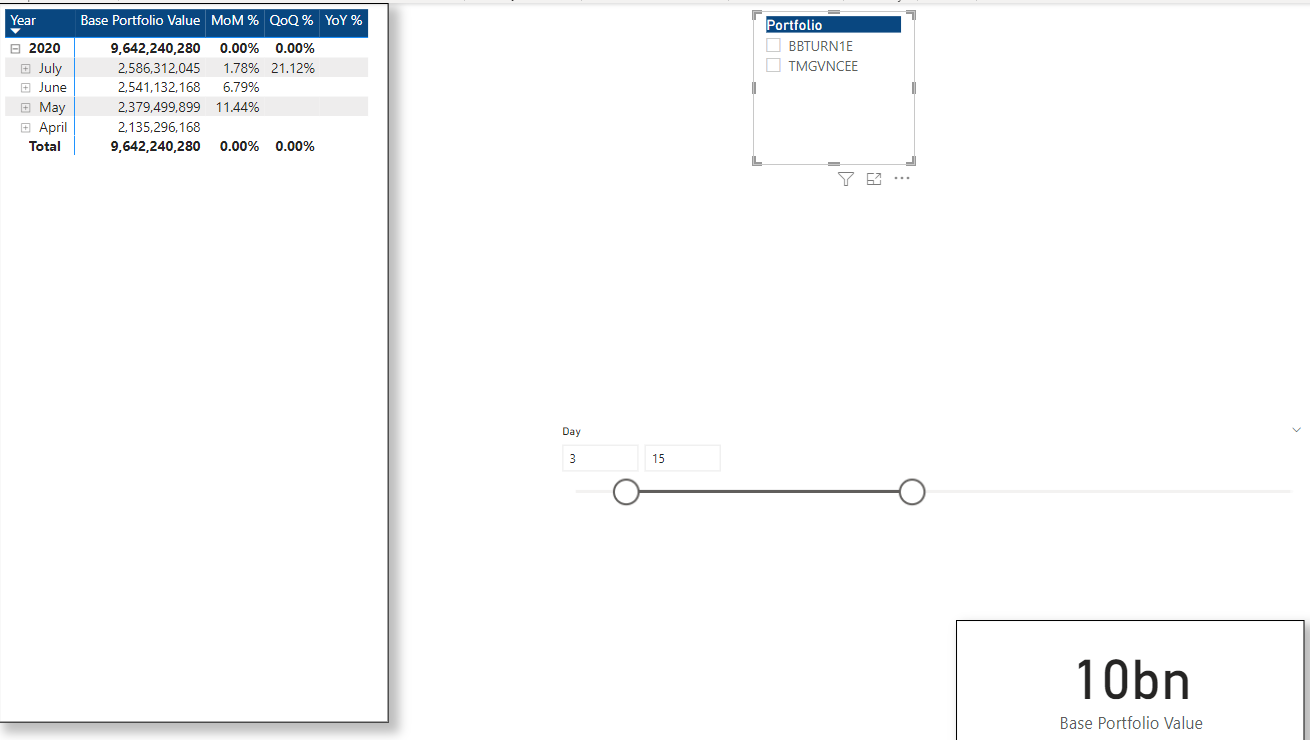
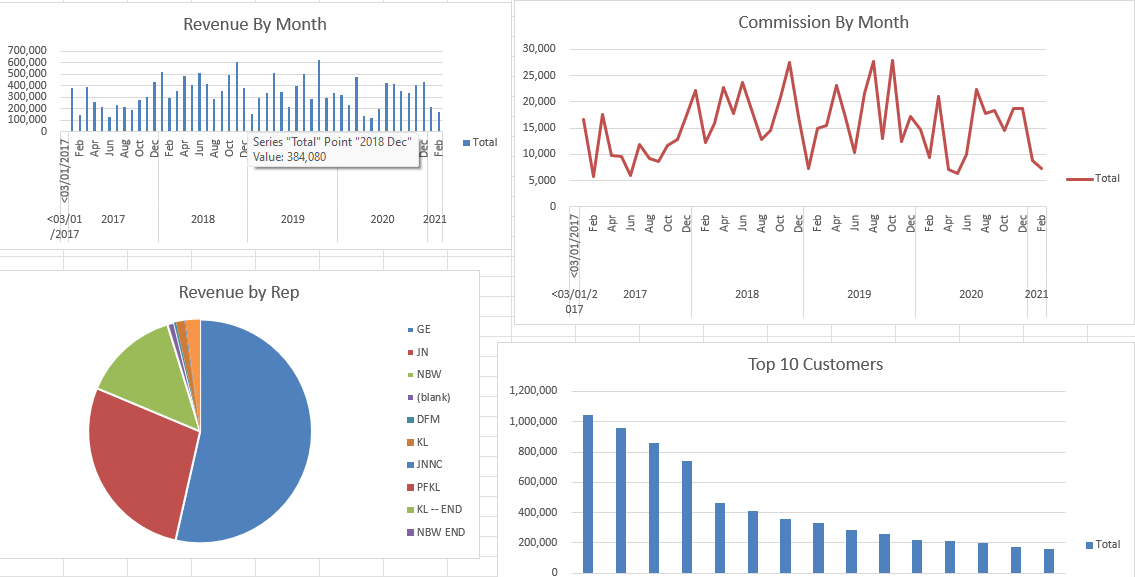
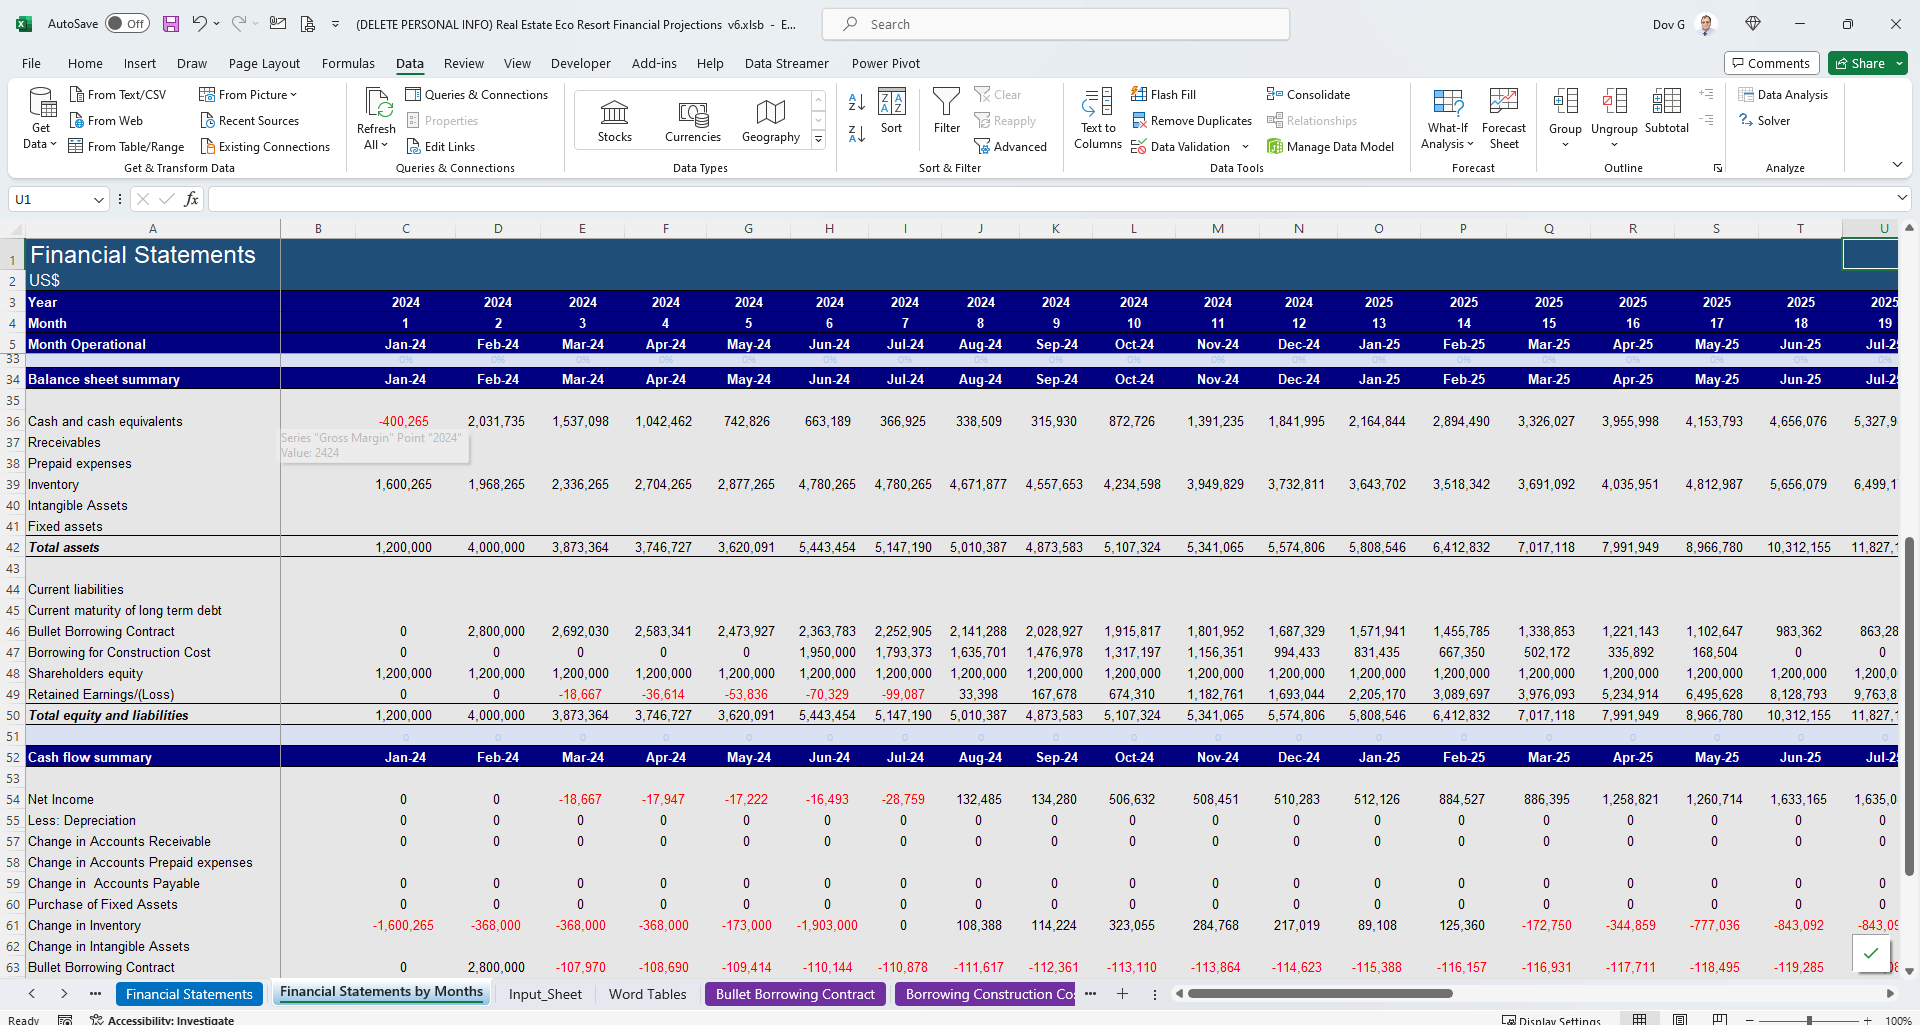
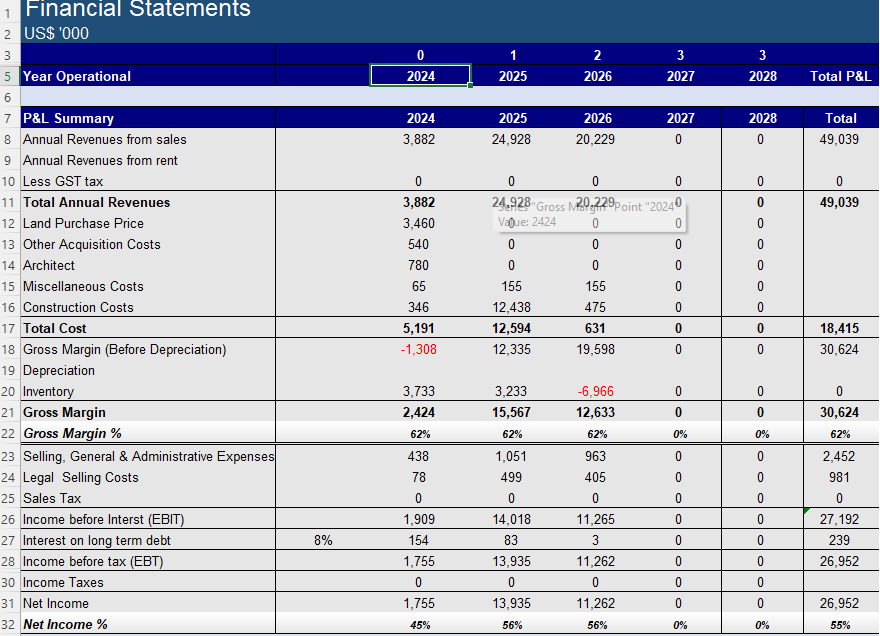
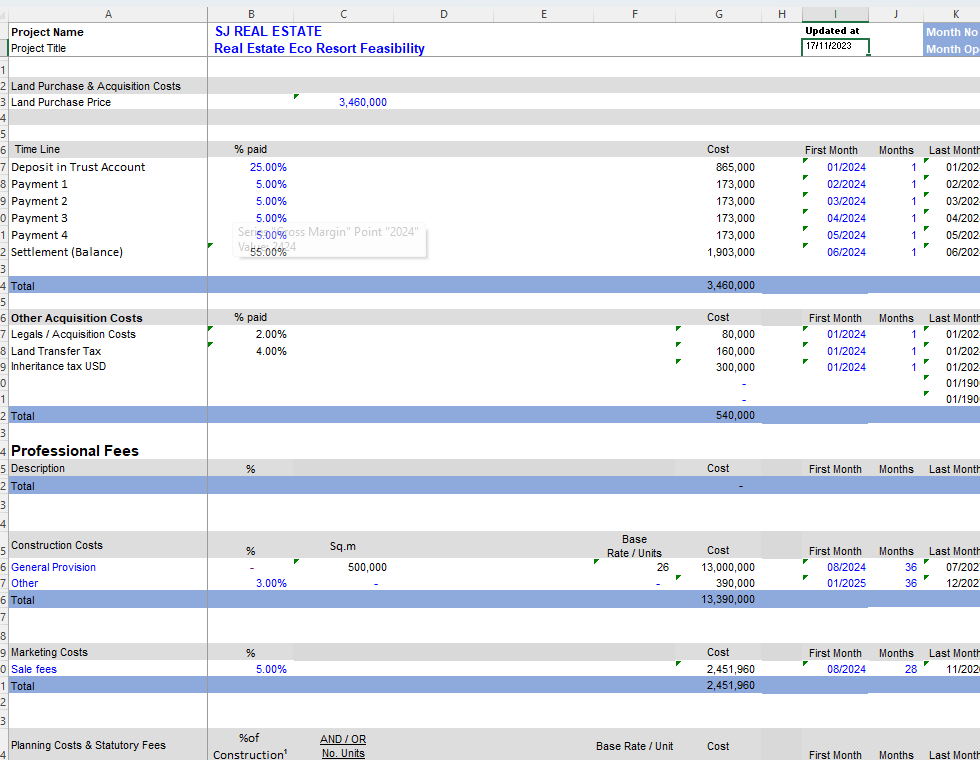
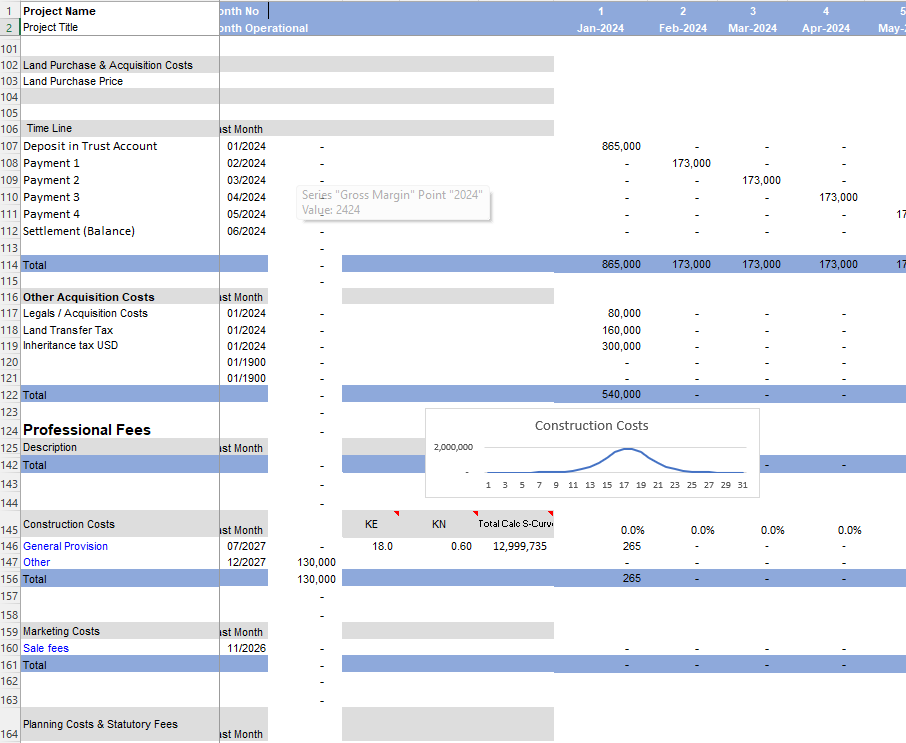
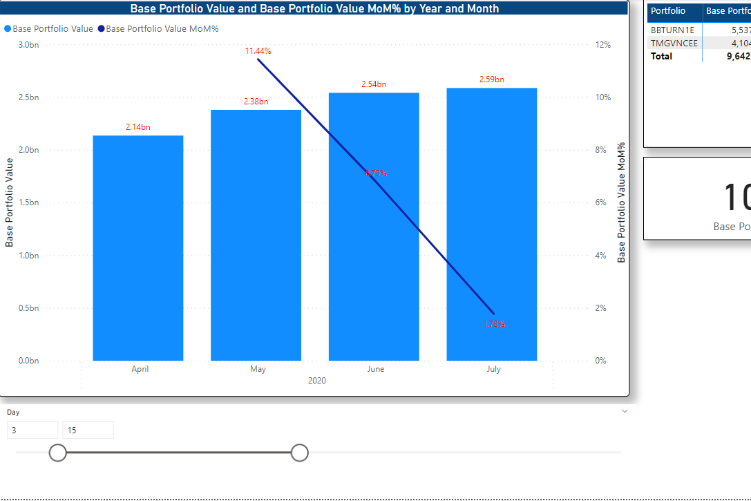
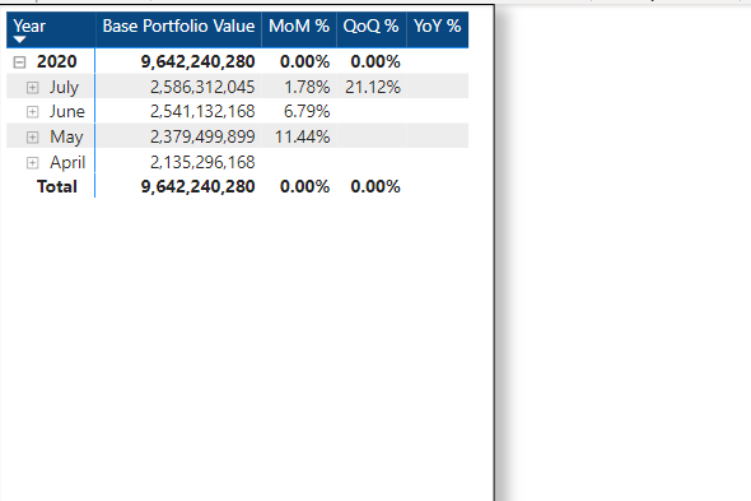
Portfolio Valuation by MoM, QoQ and YoY comparisons
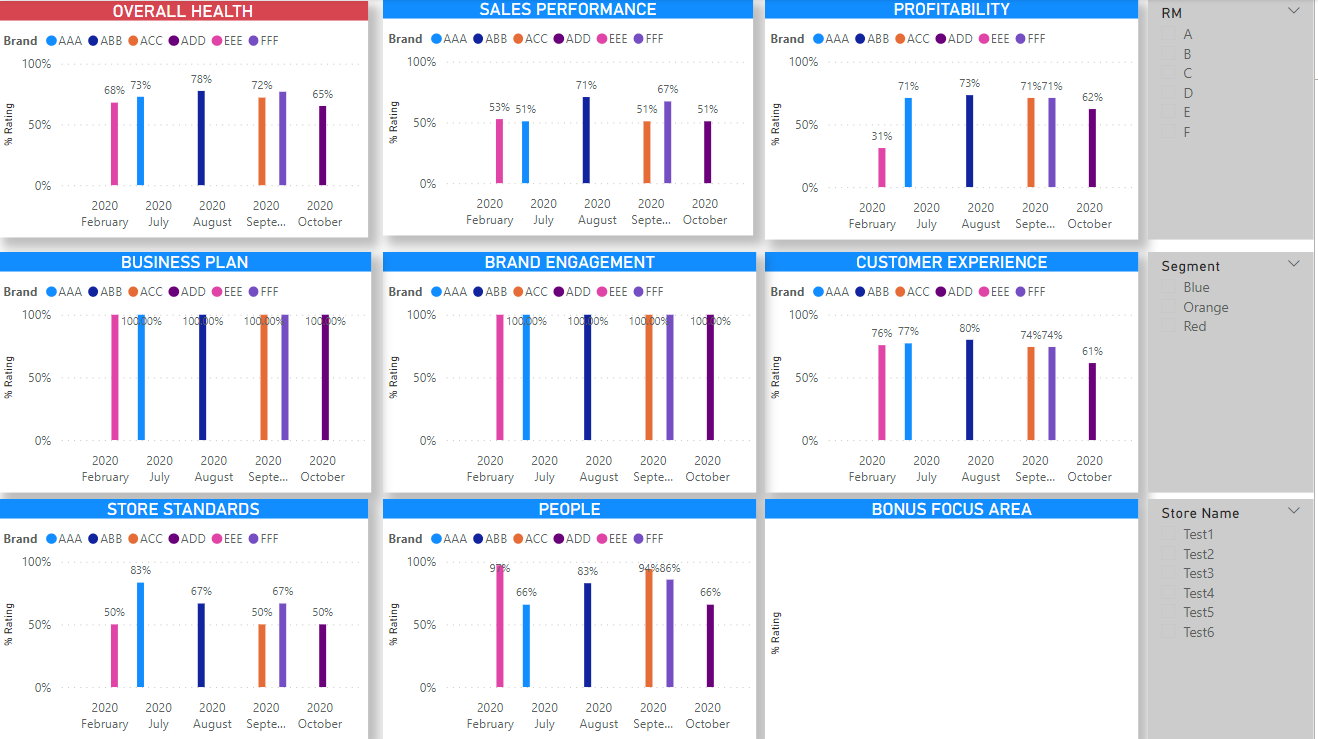
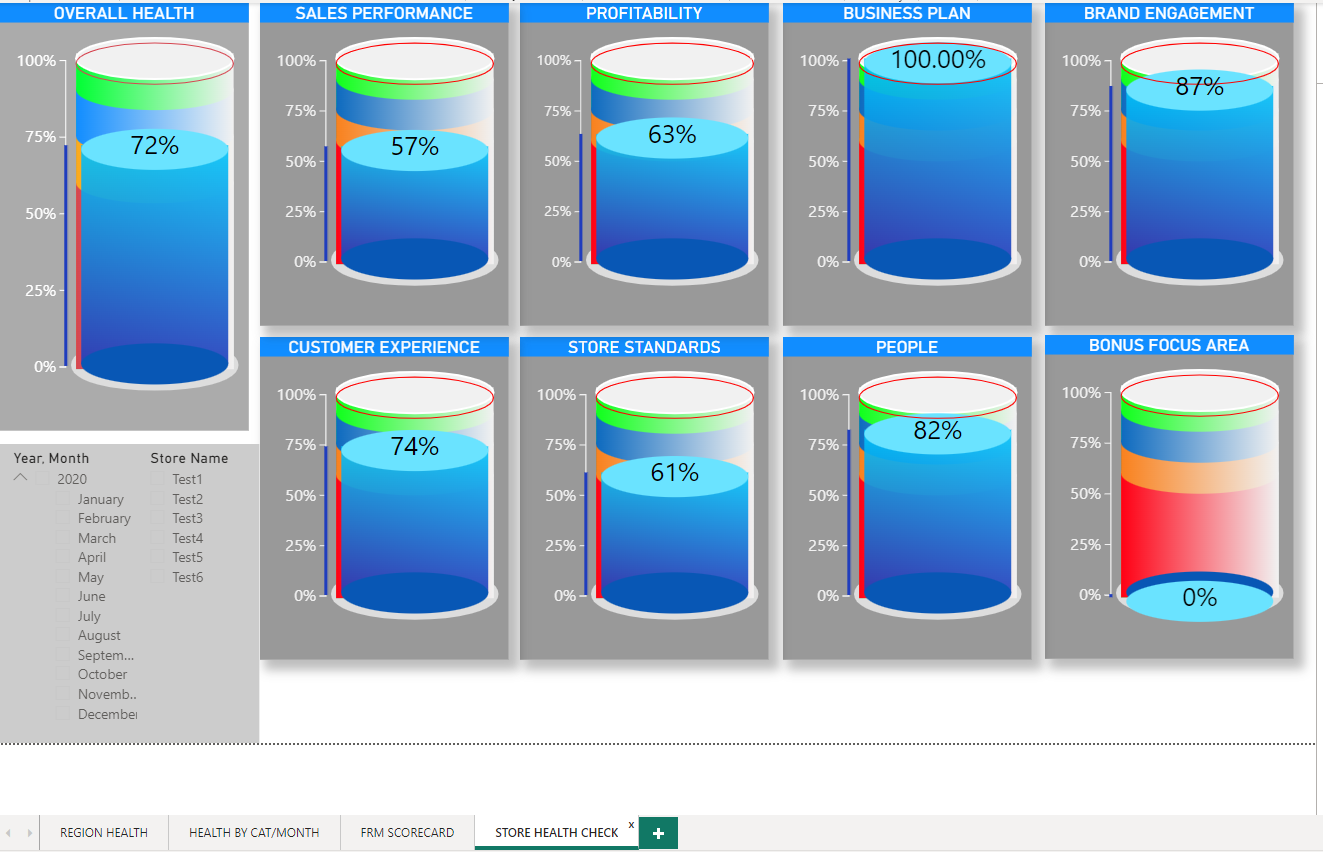
This project presents the financial performance of two centres compared to previous periods. The data source is automatically retrieved from the centres via CSV files daily and extruded and transformed by DAX Codes to fit the data into visual forms. Each dashboard shows the performance by line stacked column, line and clustered column charts. The main dashboard demonstrates the overall satisfaction by country and city on a visual map.
The following procedure is to upload the file to Power BI Cloud, which enables the users in the organization to get the dashboards on their smartphones.
Project 223
הוסף תגובה
0 תגובות
 הוסף תגובה
0 תגובות
הוסף תגובה
0 תגובות
אנא
היכנס למערכת
כדי להגיב

תיקי עבודות נוספים מאת Dov Goldenberg
Portfolio
(5)
Key Performance Indicator
(3)
Sales Analysis
(2)
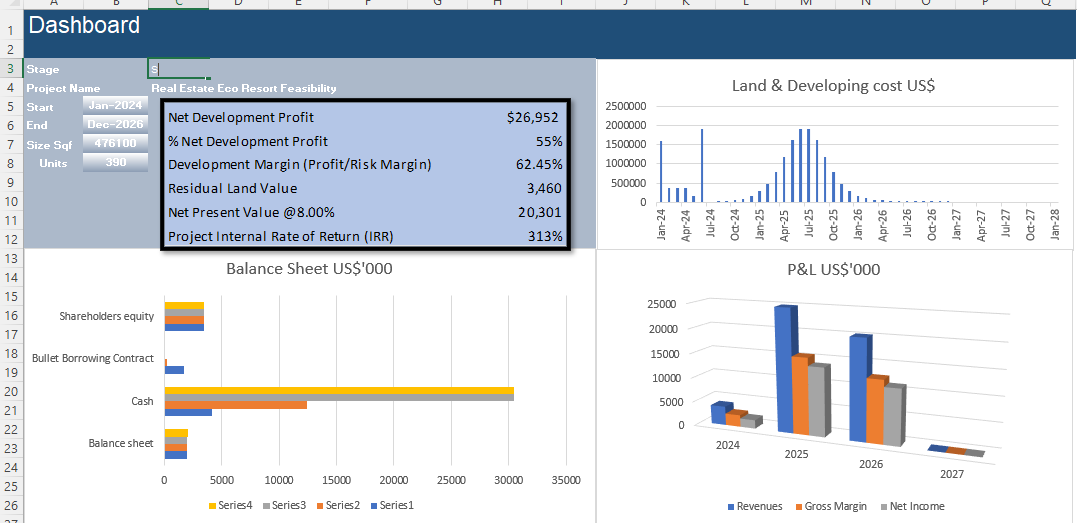
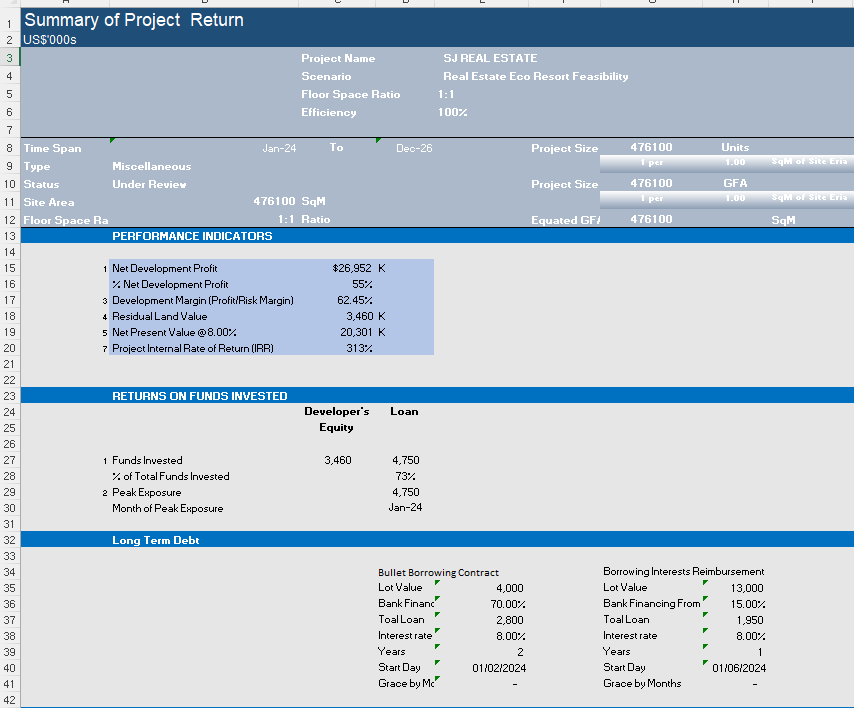
Real Estate Eco Resort
(7)